Companies
How do Santa Cruz wages really compare to Silicon Valley?

By Jim Johnson
The Compensation Depot
Deep dive analysis: Santa Cruz County vs. Silicon Valley
I recently completed a detailed pay analysis utilizing May 2013 National, State, Metropolitan, and Nonmetropolitan Area Occupational Employment and Wage estimates from the U.S. Bureau of Labor Statistics. I did this to gain a better understanding of the magnitude of the pay differential between Santa Cruz and Silicon Valley and to identify the specific job functions and classifications driving the overall pay differences. This information is being disseminated in the hope that it will help contribute to the growth of businesses in Santa Cruz County.
Well informed business managers realize that it is critical to effectively establish and maintain “competitive” pay to attract and retain quality employees. However, meaningful and trustworthy information related to pay data, especially for specific job classifications, is generally not readily available. As a result managers are forced to hire a compensation consultant or SWAG it in setting pay policy and administering pay for their employees. Unfortunately, most appear to SWAG it. This analysis will help to fill the void in meaningful, publicly available pay data.
Pay data for 261 Santa Cruz job classifications (69,300 employees) were compared with pay for the same job classifications for the San Jose Standard Metropolitan Statistical Area (SMSA) with 771,300 employees in jobs matched to Santa Cruz job titles. (Note: The San Jose SMSA is made up of all jobs in Santa Clara County and San Benito County). This article provides a high level overview of that analysis.
Please note that Santa Cruz is used interchangeably with Santa Cruz County and Silicon Valley is used synonymously with the San Jose SMSA in this analysis. Also, the term “wages” is used interchangeably with “base pay and base salaries.”
High Level Summary Statistics
My analysis begins by providing a high level overview of the competitive landscape, looking at 22 major job functional/occupational categories into which 261 specific job classifications have been “rolled up.” These categories are based on the U.S. Bureau of Labor (BLS) Standard Occupational Classification (SOC) system covering the entire spectrum of Santa Cruz jobs. These major categories are:
11 – Management Occupations
13 – Business and Financial Operations Occupations
15 – Computer and Mathematical Occupations
17 – Architecture and Engineering Occupations
19 – Life, Physical, and Social Science Occupations
21 – Community and Social Service Occupations
23 – Legal Occupations
25 – Education, Training, and Library Occupations
27 – Arts, Design, Entertainment, Sports, and Media Occupations
29 – Healthcare Practitioners and Technical Occupations
31 – Healthcare Support Occupations
33 – Protective Service Occupations
35 – Food Preparation and Serving Related Occupations
37 – Building and Grounds Cleaning and Maintenance Occupations
39 – Personal Care and Service Occupations
41 – Sales and Related Occupations
43 – Office and Administrative Support Occupations
45 – Farming, Fishing, and Forestry Occupations
47 – Construction and Extraction Occupations
49 – Installation, Maintenance, and Repair Occupations
51 – Production Occupations
53 – Transportation and Material Moving Occupations
A cautionary note: Reviewers should keep in mind that these are statistical “estimates” of wages that are based on data reported by employers in the counties involved. The data points are estimates; however, they are based upon quite possibly the most comprehensive wage database in existence, and provide a valid basis for attaining a general assessment of an area’s competitive landscape. This data should be treated as only one of several inputs in assessing the pay competitiveness of a specific enterprise.
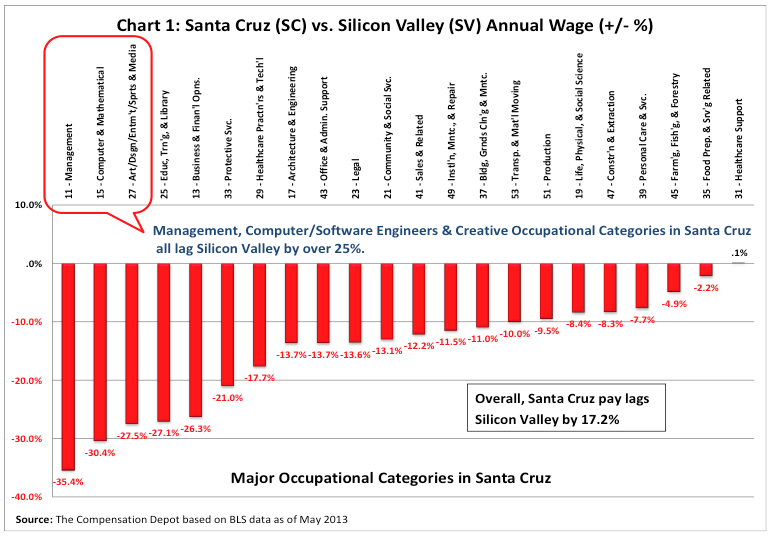
Chart 1 shows how the major job categories for Santa Cruz County compare with the Silicon Valley:
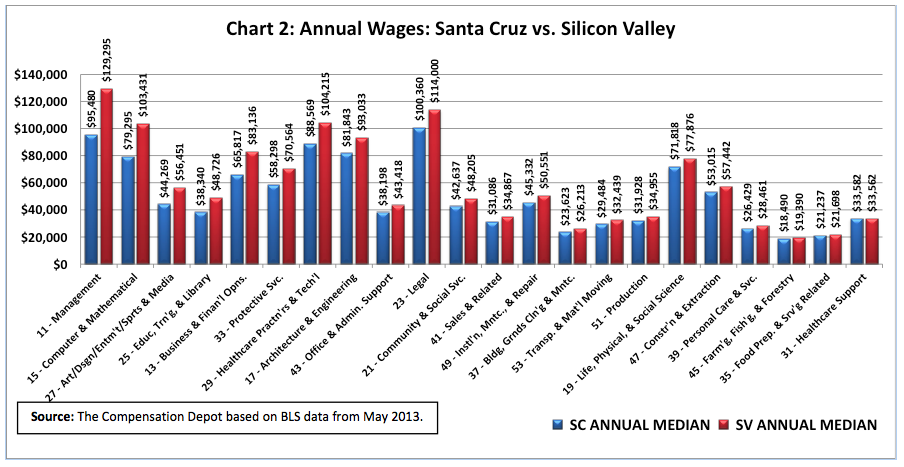
Chart 2 is included to graphically illustrate the median annual salaries for the major occupational categories (listed in the same order, from least to most competitive, as those shown in Chart 1). The (+/- %) differences in Chart 1 correlate to the variations in height between the blue and red bars for each occupational category depicted in the chart. The differences become less pronounced from left to right.
Santa Cruz median wages lag Silicon Valley in 21 of the 22 major (high level) occupational categories. While it’s common knowledge that Silicon Valley pays higher than Santa Cruz, the fact that Santa Cruz County’s Managers, Computer Jobs (e.g., Network Architects & Analysts) and Creative Talent lag by over 25% is probably not well known. (Caution: These categories are very broad. For example, the Management Occupational category includes managers from 21 specific job titles from many functional areas and disciplines, with some jobs paid much more competitively than others.)
Perspective
Those encouraging businesses to locate and/or remain in Santa Cruz (e.g., Chamber of Commerce, Small Business Development Center, etc.) might argue that this 20%+ difference be viewed as a “competitive business advantage.” After all, if skilled employees can be recruited and retained at 30% less than comparable candidates “over the hill,” then, this can translate into a real competitive advantage to starting and keeping businesses in Santa Cruz. This is the same strategy used by many Asian countries to attract American companies in the past.
It’s noteworthy that median wages for the Architecture and Engineering Occupations lag the Valley by only 13.7% indicating this group is paid more competitively in Santa Cruz than the categories mentioned above, but still somewhat less competitively than 14 of the 22 categories displayed in the charts above. It’s also somewhat interesting that 11 of these 14 categories are “blue collar” and “support” worker categories. Could this be due to local companies laying-off large numbers of lower paid blue collar and support workers during the Great Recession, leaving only the higher paid workers, who are paid more competitively relative to the Valley? One can only speculate the underlying “cause(s)” based on this one “snapshot” of data. Repeat analyses over time could help identify the trends and potential “causes” underlying such pay differences.
What amount of pay increase would it take to “entice” an otherwise satisfied Santa Cruz professional to make the commute over Hwy 17 to “the Valley”? If it’s 20%, then, the employees in the six bars on the extreme left side of the above chart might be viewed as “at risk”. (Just as a reminder, only base pay is reviewed in this analysis. Annual bonuses are generally provided as a percentage of base pay, so, a higher base will typically mean a bigger bonus. This would compound the “allure effect” of joining a higher paying firm in the Valley . . . which could, arguably, take some pain out of the killer commute on Hwy 17).
Delving into the Detail
Space constraints in this article preclude my inserting all the underlying analytical detail for each of the 22 major occupational categories highlighted above, so tabular details are included in this article for only three of the above 22 major categories. (To view the underlying detail for all 22 occupational categories and the underlying 261 jobs, download the information from: http://www.thecompensationdepot.com. Reports are available under the “Downloads” tab.)
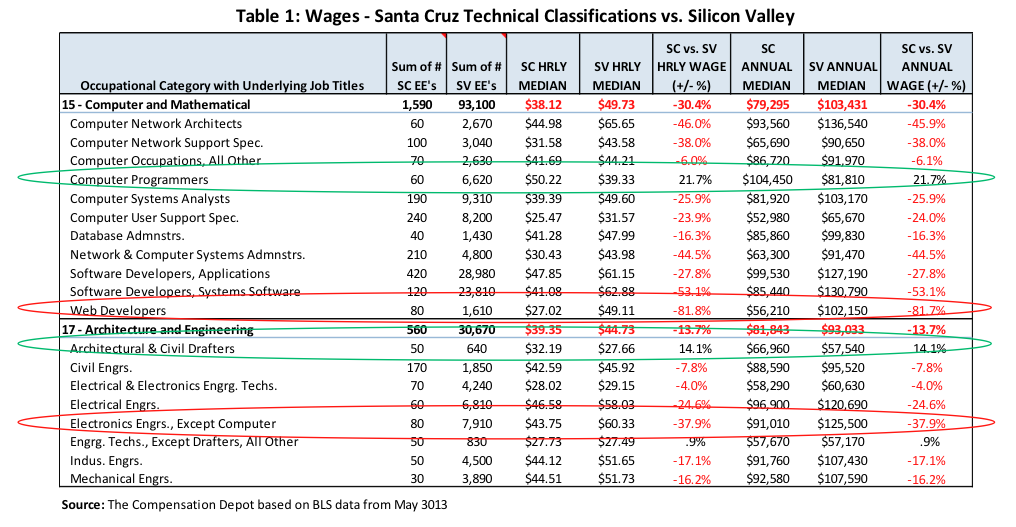
Table 1 is included in order to focus on the overall “less competitive” classifications. The underlying job classifications of the two Occupational Categories included in this table have wide variations in relative competitive positioning versus Silicon Valley. For example, in the top group, Web Developers in Santa Cruz are paid 81.7% below (red oval) the Valley while Computer Programmers actually lead the Valley by 21.7% (green oval). The same is true of the bottom group where Architectural & Civil Drafters lead the Valley by 14.1% (green oval) while Electronic Engineers lag by 37.9% (red oval).
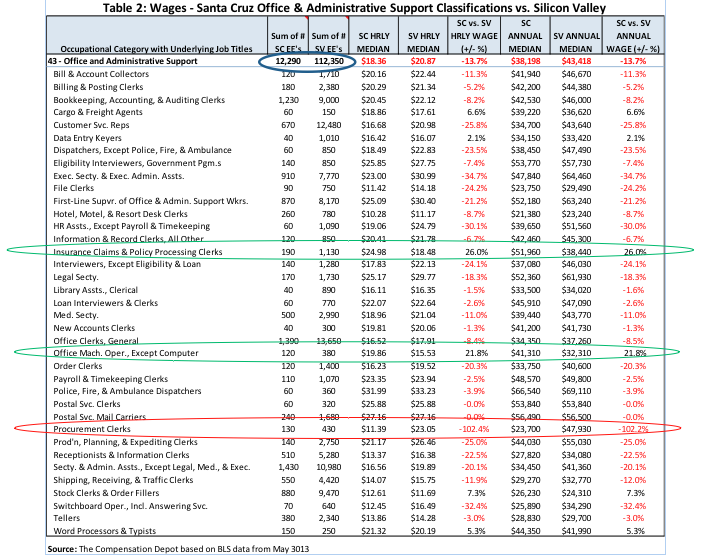
Table 2 is provided to focus on the Office and Administrative Support occupational category whose overall median is positioned “mid-range” in the Chart 1 competitive distribution. This category has a robust sampling of employees (blue oval) in 37 job titles found throughout the diverse enterprises located in Santa Cruz.
Although the detail in this table is a bit overwhelming it, like the data in Table 1, illustrates the wide variations of competitiveness found in individual job classifications. For example, Procurement Clerks would likely double their pay by taking a position in the Valley as they’re paid 102.2% (red oval) below similar positions there. On the other hand, Insurance Claims & Policy Processing Clerks (+ 26.0%) and Office Machine Operators (+ 21.8%) (green ovals) might need to take a pay cut to make the commute over the hill! (It is often very difficult to find a logical basis for differences in pay! Perhaps this is philosophically fitting, reflecting the eclectic nature of Santa Cruz.
Table 3 is included simply because Healthcare continues to be a “hot topic” and everyone, businesses executives and managers in particular, seems to be interested in the financial impact of the Affordable Care Act.
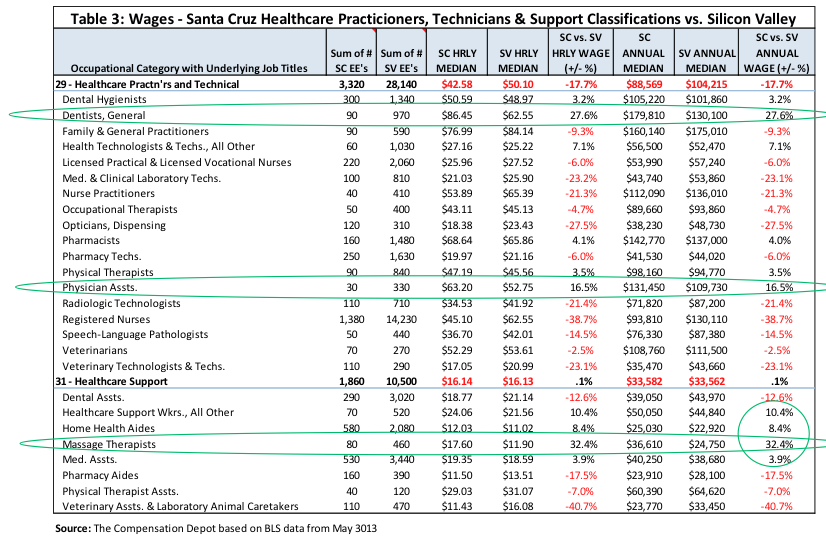 Table 3 provides some interesting data points. For example, individuals in Santa Cruz pondering a career in healthcare would most likely do well to consider a career as a Dentist or Physician’s Assistant (PA), jobs that lead the Silicon Valley by 27.6% and 16.5% (green ovals) respectively. It’s also interesting to note that 4 of the 8 classifications under Healthcare Support are paid higher (green circle) than their counterparts in Silicon Valley. Massage Therapists (+32.4%) (green oval), in particular, seem to be doing well in Santa Cruz.
General Observations
Statistical analyses involve some amount of risk. Generating quality statistical analyses is tedious and time-consuming work that demands constant attention to each step in the process. There’s no such thing as a “small error” when it comes to employees’ pay, so, it is critical that analyses involving pay be done correctly – error free – every time. There’s a potential landmine (error) in every cell of every spreadsheet. Navigating Excel requires those doing the analyses to tread carefully and lightly. That’s risk! Maybe that’s why very little usable quality information on pay data at the job level is publicly available. I hope this work helps to alleviate this problem in Santa Cruz.
I invite your comments and questions.
For more information or to contact Jim Johnson:
- http://www.thecompensationdepot.com (full analysis is available under “Downloads” tab)
- jimdjohnson99@thecompensationdepot.com
Tagged Compensation, Wages


